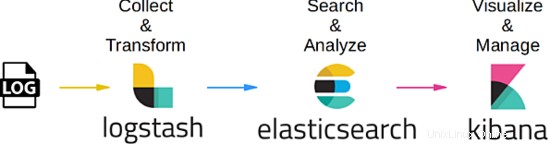
Ce didacticiel explique comment configurer un serveur de gestion centralisée des fichiers journaux à l'aide de la pile ELK sur CentOS 7. Comme tous ceux qui ne le savent pas encore, ELK est la combinaison de 3 services :ElasticSearch, Logstash et Kibana. Pour créer un serveur de gestion de journaux centralisé complet utilisant ce concept, il faudrait que chacun de ces packages ait un objectif différent et soit lié les uns aux autres. En gros, cela fonctionne comme ceci :
- Pour chaque client que vous souhaitez gérer, il produira son propre journal des services associés.
- Pour le serveur qui sera utilisé pour gérer toutes les informations de journalisation de chaque client, il utilisera le package LogStash pour collecter et transformer les données en une valeur relative. Par définition, il s'agit d'un pipeline de traitement de données open source côté serveur qui ingère des données provenant d'une multitude de sources simultanément, les transforme
- Une fois les données collectées et transformées, le serveur de gestion utilisera ElasticSearch pour aider et analyser les données à une valeur pertinente. Vous pouvez utiliser un langage de requête général si vous souhaitez produire un rapport connexe selon vos besoins
- Au fur et à mesure que les données connexes ont été vérifiées et analysées, c'est là que le package Kibana entre en scène, car il peut aider à visualiser et à gérer les données pertinentes dans une vue appropriée ou à les combiner dans un tableau de bord brillant souhaitable pour une compréhension facile.
L'image ci-dessous résume le processus de workflow :
1. Remarque préliminaire
Pour ce tutoriel, j'utilise CentOS Linux 7.4 dans la version 64 bits. Dans ce tutoriel, nous utiliserons 3 serveurs :le premier sera utilisé comme serveur de gestion et les 2 autres seront utilisés comme clients. Pour cet exercice, nous utiliserons le serveur de gestion pour surveiller un service MySQL existant qui a déjà été installé, configuré et exécuté sous chaque client. Comme MySQL est un service de base de données utilisé principalement à des fins OLTP, nous allons faire en sorte que notre serveur de gestion enregistre 2 processus de journalisation, à savoir la vérification de l'état du service MySQL lui-même et la transaction de requête lente. À la fin de ce didacticiel, nous verrons que toute information enregistrée à partir de n'importe quel service MySQL à l'intérieur d'un client dédié peut être vue, visualisée et analysée simultanément à partir du serveur de gestion directement en temps réel.
2. Phase d'installation
Pour la phase d'installation, nous commencerons par l'installation de FileBeat sur les deux serveurs de base de données MySQL qui agissent en tant que client. Commençons le processus, voici les étapes :
 [[email protected]_db1 opt]# cd
[[email protected]_db1 ~]# cd /opt/
[[email protected]_db1 opt]# wget https://artifacts.elastic.co/downloads/beats/filebeat/filebeat-6.2.1-x86_64.rpm
--2018-06-09 10:50:46-- https://artifacts.elastic.co/downloads/beats/filebeat/filebeat-6.2.1-x86_64.rpm
Resolving artifacts.elastic.co (artifacts.elastic.co)... 107.21.237.188, 107.21.253.15, 184.73.245.233, ...
Connecting to artifacts.elastic.co (artifacts.elastic.co)|107.21.237.188|:443... connected.
HTTP request sent, awaiting response... 200 OK
Length: 12697093 (12M) [binary/octet-stream]
Saving to: ‘filebeat-6.2.1-x86_64.rpm’

100%[==============================================================================>] 12,697,093 2.20MB/s in 6.9s

2018-06-09 10:51:00 (1.75 MB/s) - ‘filebeat-6.2.1-x86_64.rpm’ saved [12697093/12697093]

[[email protected]_db1 opt]# yum localinstall -y filebeat-6.2.1-x86_64.rpm
Loaded plugins: fastestmirror, ovl
Examining filebeat-6.2.1-x86_64.rpm: filebeat-6.2.1-1.x86_64
Marking filebeat-6.2.1-x86_64.rpm to be installed
Resolving Dependencies
--> Running transaction check
---> Package filebeat.x86_64 0:6.2.1-1 will be installed
--> Finished Dependency Resolution

Dependencies Resolved

========================================================================================================================
Package Arch Version Repository Size
========================================================================================================================
Installing:
filebeat x86_64 6.2.1-1 /filebeat-6.2.1-x86_64 49 M

Transaction Summary
========================================================================================================================
Install 1 Package

Total size: 49 M
Installed size: 49 M
Downloading packages:
Running transaction check
Running transaction test
Transaction test succeeded
Running transaction
Installing : filebeat-6.2.1-1.x86_64 1/1
Verifying : filebeat-6.2.1-1.x86_64 1/1

Installed:
filebeat.x86_64 0:6.2.1-1

Complete!
Une fois cela fait, nous allons lister le module par défaut activé par le package FileBeat et activer le module mysql qui est nécessaire pour nos cas ici. Voici les étapes :
 [[email protected]_db1 opt]# filebeat modules list
Enabled:

Disabled:
apache2
auditd
icinga
kafka
logstash
mysql
nginx
osquery
postgresql
redis
system
traefik
[[email protected]_db1 opt]# filebeat modules enable mysql
Enabled mysql
Terminé, éditons maintenant la configuration nécessaire pour le module mysql que nous venons d'activer. Par défaut, une fois que nous aurons activé le module mysql du package filebeat, il créera automatiquement un fichier yaml dans le répertoire modules.d. Pourtant, si le fichier n'a pas été créé, n'hésitez pas à créer un nouveau fichier yaml au même emplacement. Voici les étapes :
 [[email protected]_db1 opt]# vi /etc/filebeat/modules.d/mysql.yml
- module: mysql
error:
enabled: true
var.paths: ["/var/lib/mysql/mysql-error.log*"]

slowlog:
enabled: true
var.paths: ["/var/lib/mysql/log-slow-queries.log*"]
Comme indiqué ci-dessus, nous avons décidé de consigner 2 processus de journalisation à partir du service MySQL, à savoir la vérification de l'état de la base de données elle-même et le journal des requêtes lentes.
Maintenant, une fois que tout est fait, faisons une configuration dans le fichier de configuration principal pour filebeat sous le fichier filebeat.yml. Vous trouverez ci-dessous le jeu de configuration :
 [[email protected]_db1 opt]# vi /etc/filebeat/filebeat.yml
#=========================== Filebeat prospectors =============================

filebeat.prospectors:

- type: log

enabled: false
paths:
- /var/lib/mysql/mysql-error.log
- /var/lib/mysql/log-slow-queries.log

#============================= Filebeat modules ===============================

filebeat.config.modules:
path: ${path.config}/modules.d/*.yml
reload.enabled: false

#==================== Elasticsearch template setting ==========================

setup.template.settings:
index.number_of_shards: 3

#================================ General =====================================

setup.kibana:

#----------------------------- Logstash output --------------------------------
output.logstash:
hosts: ["172.17.0.6:5044"]
Notez ci-dessus que nous avons défini une adresse IP pour l'hôte logstash qui est 172.17.0.6. Cette adresse IP est l'adresse de notre serveur de gestion centralisé qui explorera directement pour collecter les données de journalisation. J'ai défini l'adresse IP codée en dur car je n'ai apporté aucune modification alternative au fichier /etc/hosts et je n'ai utilisé aucun serveur DNS pour ce didacticiel. Cependant, n'hésitez pas à utiliser le nom d'hôte du serveur de gestion si vous avez effectué les modifications alternatives.
Comme tout a été configuré selon le plan, démarrons les services filebeat. Voici les étapes :
 [[email protected]_db1 opt]# filebeat setup -e
2018-06-09T11:04:37.277Z INFO instance/beat.go:468 Home path: [/usr/share/filebeat] Config path: [/etc/filebeat] Data path: [/var/lib/filebeat] Logs path: [/var/log/filebeat]
2018-06-09T11:04:37.277Z INFO instance/beat.go:475 Beat UUID: 98503460-035e-4476-8e4d-10470433dba5
2018-06-09T11:04:37.277Z INFO instance/beat.go:213 Setup Beat: filebeat; Version: 6.2.1
2018-06-09T11:04:37.277Z INFO pipeline/module.go:76 Beat name: lara
2018-06-09T11:04:37.278Z ERROR instance/beat.go:667 Exiting: Template loading requested but the Elasticsearch output is not configured/enabled
Exiting: Template loading requested but the Elasticsearch output is not configured/enabled


[[email protected]_db1 opt]# filebeat -e &
[1] 22010
[[email protected]_db1 opt]# 2018-06-09T12:45:18.812Z INFO instance/beat.go:468 Home path: [/usr/share/filebeat] Config path: [/etc/filebeat] Data path: [/var/lib/filebeat] Logs path: [/var/log/filebeat]
2018-06-09T12:45:18.813Z INFO instance/beat.go:475 Beat UUID: 98503460-035e-4476-8e4d-10470433dba5
2018-06-09T12:45:18.813Z INFO instance/beat.go:213 Setup Beat: filebeat; Version: 6.2.1
2018-06-09T12:45:18.813Z INFO pipeline/module.go:76 Beat name: lara
2018-06-09T12:45:18.813Z INFO [monitoring] log/log.go:97 Starting metrics logging every 30s
2018-06-09T12:45:18.813Z INFO instance/beat.go:301 filebeat start running.
2018-06-09T12:45:18.814Z INFO registrar/registrar.go:71 No registry file found under: /var/lib/filebeat/registry. Creating a new registry file.
2018-06-09T12:45:18.819Z INFO registrar/registrar.go:108 Loading registrar data from /var/lib/filebeat/registry
2018-06-09T12:45:18.819Z INFO registrar/registrar.go:119 States Loaded from registrar: 0
2018-06-09T12:45:18.819Z WARN beater/filebeat.go:261 Filebeat is unable to load the Ingest Node pipelines for the configured modules because the Elasticsearch output is not configured/enabled. If you have already loaded the Ingest Node pipelines or are using Logstash pipelines, you can ignore this warning.
2018-06-09T12:45:18.820Z INFO crawler/crawler.go:48 Loading Prospectors: 1
2018-06-09T12:45:18.821Z INFO log/prospector.go:111 Configured paths: [/var/lib/mysql/log-slow-queries.log*]
2018-06-09T12:45:18.822Z INFO log/prospector.go:111 Configured paths: [/var/lib/mysql/mysql-error.log*]
2018-06-09T12:45:18.822Z INFO crawler/crawler.go:82 Loading and starting Prospectors completed. Enabled prospectors: 0
2018-06-09T12:45:18.822Z INFO cfgfile/reload.go:127 Config reloader started
2018-06-09T12:45:18.840Z INFO log/prospector.go:111 Configured paths: [/var/lib/mysql/log-slow-queries.log*]
2018-06-09T12:45:18.840Z INFO log/prospector.go:111 Configured paths: [/var/lib/mysql/mysql-error.log*]
2018-06-09T12:45:18.840Z INFO cfgfile/reload.go:258 Starting 1 runners ...
2018-06-09T12:45:18.840Z INFO cfgfile/reload.go:219 Loading of config files completed.
2018-06-09T12:45:18.841Z INFO log/harvester.go:216 Harvester started for file: /var/lib/mysql/mysql-error.log
2018-06-09T12:45:18.841Z INFO log/harvester.go:216 Harvester started for file: /var/lib/mysql/log-slow-queries.log
2018-06-09T12:45:20.841Z ERROR pipeline/output.go:74 Failed to connect: dial tcp 172.17.0.6:5044: getsockopt: connection refused
2018-06-09T12:45:22.842Z ERROR pipeline/output.go:74 Failed to connect: dial tcp 172.17.0.6:5044: getsockopt: connection refused
2018-06-09T12:45:26.842Z ERROR pipeline/output.go:74 Failed to connect: dial tcp 172.17.0.6:5044: getsockopt: connection refused


[[email protected]_db1 ~]# tail -f /var/log/filebeat/filebeat
2018-06-09T10:53:28.853Z INFO instance/beat.go:468 Home path: [/usr/share/filebeat] Config path: [/etc/filebeat] Data path: [/var/lib/filebeat] Logs path: [/var/log/filebeat]
2018-06-09T10:53:28.853Z INFO instance/beat.go:475 Beat UUID: 98503460-035e-4476-8e4d-10470433dba5
Notez qu'une fois que vous avez démarré le service filebeat, une erreur s'affiche sous le journal. Cela était dû au fait que le serveur de gestion qui avait été attribué n'était pas encore configuré. Pour la phase initiale, vous pouvez ignorer le journal des erreurs car il sera automatiquement récupéré une fois que notre serveur de gestion aura été configuré et commencé à explorer.
Une fois la configuration de la base client terminée, vous pouvez continuer à répliquer les étapes sur l'autre serveur MySQL qui agit également en tant que client.
À l'avenir, nous continuerons à configurer le serveur de gestion lui-même.
3. Phase d'installation (côté serveur de gestion centralisée)
Maintenant que nous avons terminé la configuration pour la préparation côté client, démarrons la configuration nécessaire pour le serveur de gestion lui-même. Selon le brief, il y a 3 packages de base qui devaient être installés et configurés pour le serveur de gestion qui est ElasticSearch, LogStash et Kibana.
Pour cette phase, nous commencerons d'abord l'installation et la configuration nécessaires pour ElasticSearch, voici les étapes ci-dessous :
 [[email protected]_master ~]# cd /opt/
[[email protected]_master opt]# ls
[[email protected]_master opt]# wget https://artifacts.elastic.co/downloads/elasticsearch/elasticsearch-6.2.1.tar.gz
--2018-06-09 12:47:59-- https://artifacts.elastic.co/downloads/elasticsearch/elasticsearch-6.2.1.tar.gz
Resolving artifacts.elastic.co (artifacts.elastic.co)... 107.21.237.188, 54.235.82.130, 107.21.253.15, ...
Connecting to artifacts.elastic.co (artifacts.elastic.co)|107.21.237.188|:443... connected.
HTTP request sent, awaiting response... 200 OK
Length: 29049089 (28M) [binary/octet-stream]
Saving to: ‘elasticsearch-6.2.1.tar.gz’

100%[==============================================================================>] 29,049,089 2.47MB/s in 16s

2018-06-09 12:48:21 (1.76 MB/s) - ‘elasticsearch-6.2.1.tar.gz’ saved [29049089/29049089]

[[email protected]_master opt]#
[[email protected]_master opt]#
[[email protected]_master opt]# tar -zxvf elasticsearch-6.2.1.tar.gz

[[email protected]_master opt]# ln -s /opt/elasticsearch-6.2.1 /opt/elasticsearch
[[email protected]_master opt]# ll
total 28372
lrwxrwxrwx 1 root root 24 Jun 9 12:49 elasticsearch -> /opt/elasticsearch-6.2.1
drwxr-xr-x 8 root root 143 Feb 7 19:36 elasticsearch-6.2.1
-rw-r--r-- 1 root root 29049089 May 15 04:56 elasticsearch-6.2.1.tar.gz
L'installation d'elasticsearch étant terminée, continuons la partie configuration. Pour le côté configuration, nous assignerons le répertoire /data/data pour stocker les données de journalisation collectées qui ont été analysées. Le répertoire lui-même sera également utilisé pour stocker l'index qui sera utilisé par elasticSearch lui-même pour une requête plus rapide. Car le répertoire /data/logs sera utilisé par elasticSearch lui-même à ses propres fins de journalisation. Voici les étapes :
 [[email protected]_master opt]# mkdir -p /data/data
[[email protected]_master opt]# mkdir -p /data/logs
[[email protected]_master opt]#
[[email protected]_master opt]# cd elasticsearch
[[email protected]_master elasticsearch]# ls
bin config lib LICENSE.txt logs modules NOTICE.txt plugins README.textile
[[email protected]_master elasticsearch]# cd config/
[[email protected]_master config]# vi elasticsearch.yml
# ---------------------------------- Cluster -----------------------------------
cluster.name: log_cluster
#
# ------------------------------------ Node ------------------------------------
#
node.name: elk_master
#
# ----------------------------------- Paths ------------------------------------
#
path.data: /data/data
path.logs: /data/logs
#
network.host: 172.17.0.6
C'est fait, pour qu'ElasticSearch fonctionne, il faut que Java soit configuré. Vous trouverez ci-dessous les étapes d'installation et de configuration de Java sur le serveur.
 [[email protected]_master config]# wget --no-cookies --no-check-certificate --header "Cookie: gpw_e24=http%3A%2F%2Fwww.oracle.com%2F; oraclelicense=accept-securebackup-cookie" "http://download.oracle.com/otn-pub/java/jdk/8u131-b11/d54c1d3a095b4ff2b6607d096fa80163/jdk-8u131-linux-x64.rpm"
--2018-06-09 12:57:05-- http://download.oracle.com/otn-pub/java/jdk/8u131-b11/d54c1d3a095b4ff2b6607d096fa80163/jdk-8u131-linux-x64.rpm
Resolving download.oracle.com (download.oracle.com)... 23.49.16.62
Connecting to download.oracle.com (download.oracle.com)|23.49.16.62|:80... connected.
HTTP request sent, awaiting response... 302 Moved Temporarily
Location: https://edelivery.oracle.com/otn-pub/java/jdk/8u131-b11/d54c1d3a095b4ff2b6607d096fa80163/jdk-8u131-linux-x64.rpm [following]
--2018-06-09 12:57:10-- https://edelivery.oracle.com/otn-pub/java/jdk/8u131-b11/d54c1d3a095b4ff2b6607d096fa80163/jdk-8u131-linux-x64.rpm
Resolving edelivery.oracle.com (edelivery.oracle.com)... 104.103.48.174, 2600:1417:58:181::2d3e, 2600:1417:58:188::2d3e
Connecting to edelivery.oracle.com (edelivery.oracle.com)|104.103.48.174|:443... connected.
HTTP request sent, awaiting response... 302 Moved Temporarily
Location: http://download.oracle.com/otn-pub/java/jdk/8u131-b11/d54c1d3a095b4ff2b6607d096fa80163/jdk-8u131-linux-x64.rpm?AuthParam=1528549151_b1fd01d854bc0423600a83c36240028e [following]
--2018-06-09 12:57:11-- http://download.oracle.com/otn-pub/java/jdk/8u131-b11/d54c1d3a095b4ff2b6607d096fa80163/jdk-8u131-linux-x64.rpm?AuthParam=1528549151_b1fd01d854bc0423600a83c36240028e
Connecting to download.oracle.com (download.oracle.com)|23.49.16.62|:80... connected.
HTTP request sent, awaiting response... 200 OK
Length: 169983496 (162M) [application/x-redhat-package-manager]
Saving to: ‘jdk-8u131-linux-x64.rpm’

100%[==============================================================================>] 169,983,496 2.56MB/s in 64s

2018-06-09 12:58:15 (2.54 MB/s) - ‘jdk-8u131-linux-x64.rpm’ saved [169983496/169983496]

[[email protected]_master config]# yum localinstall -y jdk-8u131-linux-x64.rpm


[[email protected]_master config]# vi /root/.bash_profile
export JAVA_HOME=/usr/java/jdk1.8.0_131
PATH=$JAVA_HOME/bin:$PATH:$HOME/bin
export PATH

[[email protected]_master config]# . /root/.bash_profile
[[email protected]_master config]# java -version
java version "1.8.0_131"
Java(TM) SE Runtime Environment (build 1.8.0_131-b11)
Java HotSpot(TM) 64-Bit Server VM (build 25.131-b11, mixed mode)
Terminé, maintenant elasticSearch a été installé et configuré sur le serveur. Cependant, en raison de certaines politiques de sécurité, elasticSearch est interdit d'être exécuté par l'utilisateur root, nous allons donc créer un utilisateur supplémentaire pour être propriétaire du service elasticSearch et l'exécuter. Vous trouverez ci-dessous les étapes de création de l'utilisateur dédié :
 [[email protected]_master config]# useradd -s /bin/bash shahril
[[email protected]_master config]# passwd shahril
Changing password for user shahril.
New password:
BAD PASSWORD: The password fails the dictionary check - it is too simplistic/systematic
Retype new password:
passwd: all authentication tokens updated successfully.

[[email protected]_master config]# chown -R shahril:shahril /data/
[[email protected]_master config]# sysctl -w vm.max_map_count=262144
vm.max_map_count = 262144
Une fois cela fait, connectez-vous en tant qu'utilisateur et vous pourrez démarrer les services elasticSearch.
 [[email protected]_master config]# su - shahril
Last login: Sat Jun 9 13:03:07 UTC 2018 on pts/1
[[email protected]_master ~]$
[[email protected]_master ~]$
[[email protected]_master ~]$
[[email protected]_master ~]$ /opt/elasticsearch/bin/elasticsearch &
[1] 7295
[[email protected]_master ~]$ [2018-06-09T13:06:26,667][INFO ][o.e.n.Node ] [elk_master] initializing ...
[2018-06-09T13:06:26,721][INFO ][o.e.e.NodeEnvironment ] [elk_master] using [1] data paths, mounts [[/ (rootfs)]], net usable_space [394.3gb], net total_space [468.2gb], types [rootfs]
[2018-06-09T13:06:26,722][INFO ][o.e.e.NodeEnvironment ] [elk_master] heap size [990.7mb], compressed ordinary object pointers [true]
[2018-06-09T13:06:26,723][INFO ][o.e.n.Node ] [elk_master] node name [elk_master], node ID [xjNoA9mMSGiXYmFPRNlXBg]
[2018-06-09T13:06:26,723][INFO ][o.e.n.Node ] [elk_master] version[6.2.1], pid[7295], build[7299dc3/2018-02-07T19:34:26.990113Z], OS[Linux/3.10.0-693.17.1.el7.x86_64/amd64], JVM[Oracle Corporation/Java HotSpot(TM) 64-Bit Server VM/1.8.0_131/25.131-b11]
[2018-06-09T13:06:26,723][INFO ][o.e.n.Node ] [elk_master] JVM arguments [-Xms1g, -Xmx1g, -XX:+UseConcMarkSweepGC, -XX:CMSInitiatingOccupancyFraction=75, -XX:+UseCMSInitiatingOccupancyOnly, -XX:+AlwaysPreTouch, -Xss1m, -Djava.awt.headless=true, -Dfile.encoding=UTF-8, -Djna.nosys=true, -XX:-OmitStackTraceInFastThrow, -Dio.netty.noUnsafe=true, -Dio.netty.noKeySetOptimization=true, -Dio.netty.recycler.maxCapacityPerThread=0, -Dlog4j.shutdownHookEnabled=false, -Dlog4j2.disable.jmx=true, -Djava.io.tmpdir=/tmp/elasticsearch.U6ilAwt9, -XX:+HeapDumpOnOutOfMemoryError, -XX:+PrintGCDetails, -XX:+PrintGCDateStamps, -XX:+PrintTenuringDistribution, -XX:+PrintGCApplicationStoppedTime, -Xloggc:logs/gc.log, -XX:+UseGCLogFileRotation, -XX:NumberOfGCLogFiles=32, -XX:GCLogFileSize=64m, -Des.path.home=/opt/elasticsearch, -Des.path.conf=/opt/elasticsearch/config]
[2018-06-09T13:06:27,529][INFO ][o.e.p.PluginsService ] [elk_master] loaded module [aggs-matrix-stats]
[2018-06-09T13:06:27,529][INFO ][o.e.p.PluginsService ] [elk_master] loaded module [analysis-common]
[2018-06-09T13:06:27,529][INFO ][o.e.p.PluginsService ] [elk_master] loaded module [ingest-common]
[2018-06-09T13:06:27,530][INFO ][o.e.p.PluginsService ] [elk_master] loaded module [lang-expression]
[2018-06-09T13:06:27,530][INFO ][o.e.p.PluginsService ] [elk_master] loaded module [lang-mustache]
[2018-06-09T13:06:27,530][INFO ][o.e.p.PluginsService ] [elk_master] loaded module [lang-painless]
[2018-06-09T13:06:27,530][INFO ][o.e.p.PluginsService ] [elk_master] loaded module [mapper-extras]
[2018-06-09T13:06:27,530][INFO ][o.e.p.PluginsService ] [elk_master] loaded module [parent-join]
[2018-06-09T13:06:27,530][INFO ][o.e.p.PluginsService ] [elk_master] loaded module [percolator]
[2018-06-09T13:06:27,531][INFO ][o.e.p.PluginsService ] [elk_master] loaded module [rank-eval]
[2018-06-09T13:06:27,532][INFO ][o.e.p.PluginsService ] [elk_master] loaded module [reindex]
[2018-06-09T13:06:27,532][INFO ][o.e.p.PluginsService ] [elk_master] loaded module [repository-url]
[2018-06-09T13:06:27,533][INFO ][o.e.p.PluginsService ] [elk_master] loaded module [transport-netty4]
[2018-06-09T13:06:27,533][INFO ][o.e.p.PluginsService ] [elk_master] loaded module [tribe]
[2018-06-09T13:06:27,534][INFO ][o.e.p.PluginsService ] [elk_master] no plugins loaded
Excellent, maintenant elasticSearch est opérationnel sans aucun problème, vous remarquerez que des ports supplémentaires sont établis à l'intérieur du serveur qui se rapportent au service elasticSearch. Vous pouvez vérifier le port indiqué ci-dessous :
 [[email protected]_master config]# netstat -apn|grep -i :9
tcp 0 0 172.17.0.6:9200 0.0.0.0:* LISTEN 7295/java
tcp 0 0 172.17.0.6:9300 0.0.0.0:* LISTEN 7295/java
Passons maintenant à la configuration et à la configuration des services logstash. Vous trouverez ci-dessous les étapes nécessaires au processus d'installation :
 [[email protected]_master opt]# wget https://artifacts.elastic.co/downloads/logstash/logstash-6.2.1.rpm
--2018-06-09 13:07:51-- https://artifacts.elastic.co/downloads/logstash/logstash-6.2.1.rpm
Resolving artifacts.elastic.co (artifacts.elastic.co)... 107.21.253.15, 23.21.67.46, 107.21.237.188, ...
Connecting to artifacts.elastic.co (artifacts.elastic.co)|107.21.253.15|:443... connected.
HTTP request sent, awaiting response... 200 OK
Length: 140430729 (134M) [binary/octet-stream]
Saving to: ‘logstash-6.2.1.rpm’

100%[==============================================================================>] 140,430,729 2.19MB/s in 60s

2018-06-09 13:08:57 (2.24 MB/s) - ‘logstash-6.2.1.rpm’ saved [140430729/140430729]

[[email protected]_master opt]# yum localinstall -y logstash-6.2.1.rpm
Loaded plugins: fastestmirror, ovl
Examining logstash-6.2.1.rpm: 1:logstash-6.2.1-1.noarch
Marking logstash-6.2.1.rpm to be installed
Resolving Dependencies
--> Running transaction check
---> Package logstash.noarch 1:6.2.1-1 will be installed
--> Finished Dependency Resolution

Dependencies Resolved

========================================================================================================================
Package Arch Version Repository Size
========================================================================================================================
Installing:
logstash noarch 1:6.2.1-1 /logstash-6.2.1 224 M

Transaction Summary
========================================================================================================================
Install 1 Package

Total size: 224 M
Installed size: 224 M
Downloading packages:
Running transaction check
Running transaction test
Transaction test succeeded
Running transaction
Installing : 1:logstash-6.2.1-1.noarch 1/1
Using provided startup.options file: /etc/logstash/startup.options
Successfully created system startup script for Logstash
Verifying : 1:logstash-6.2.1-1.noarch 1/1

Installed:
logstash.noarch 1:6.2.1-1

Complete!
Une fois l'installation terminée, appliquez la configuration nécessaire comme ci-dessous :
 [[email protected]_master opt]# vi /etc/logstash/conf.d/02-mysql-log.conf

input {
beats {
port => 5044
host => "0.0.0.0"
}
}


filter {
if [fileset][module] == "mysql" {
if [fileset][name] == "error" {
grok {
match => { "message" => ["%{LOCALDATETIME:[mysql][error][timestamp]} (\[%{DATA:[mysql][error][level]}\] )?%{GREEDYDATA:[mysql][error][message]}",
"%{TIMESTAMP_ISO8601:[mysql][error][timestamp]} %{NUMBER:[mysql][error][thread_id]} \[%{DATA:[mysql][error][level]}\] %{GREEDYDATA:[mysql][error][message1]}",
"%{GREEDYDATA:[mysql][error][message2]}"] }
pattern_definitions => {
"LOCALDATETIME" => "[0-9]+ %{TIME}"
}
remove_field => "message"
}
mutate {
rename => { "[mysql][error][message1]" => "[mysql][error][message]" }
}
mutate {
rename => { "[mysql][error][message2]" => "[mysql][error][message]" }
}
date {
match => [ "[mysql][error][timestamp]", "ISO8601", "YYMMdd H:m:s" ]
remove_field => "[mysql][error][time]"
}
}
else if [fileset][name] == "slowlog" {
grok {
match => { "message" => ["^# [email protected]: %{USER:[mysql][slowlog][user]}(\[[^\]]+\])? @ %{HOSTNAME:[mysql][slowlog][host]} \[(IP:[mysql][slowlog][ip])?\](\s*Id:\s* %{NUMBER:[mysql][slowlog][id]})?\n# Query_time: %{NUMBER:[mysql][slowlog][query_time][sec]}\s* Lock_time: %{NUMBER:[mysql][slowlog][lock_time][sec]}\s* Rows_sent: %{NUMBER:[mysql][slowlog][rows_sent]}\s* Rows_examined: %{NUMBER:[mysql][slowlog][rows_examined]}\n(SET timestamp=%{NUMBER:[mysql][slowlog][timestamp]};\n)?%{GREEDYMULTILINE:[mysql][slowlog][query]}"] }
pattern_definitions => {
"GREEDYMULTILINE" => "(.|\n)*"
}
remove_field => "message"
}
date {
match => [ "[mysql][slowlog][timestamp]", "UNIX" ]
}
mutate {
gsub => ["[mysql][slowlog][query]", "\n# Time: [0-9]+ [0-9][0-9]:[0-9][0-9]:[0-9][0-9](\\.[0-9]+)?$", ""]
}
}
}
}


output {
elasticsearch {
hosts => "172.17.0.6"
manage_template => false
index => "%{[@metadata][beat]}-%{[@metadata][version]}-%{+YYYY.MM.dd}"
}
}
Notez qu'à partir de la configuration effectuée ci-dessus, nous avons défini l'entrée à prendre à partir du service filebeat côté client qui utilise le port 5044. Nous avons également défini une annotation appropriée pour logstash afin d'aligner les données brutes extraites de chaque côté client. Cela est nécessaire pour qu'il soit plus facile d'être visualisé et analysé du côté d'elasticSearch.
Ensuite, nous devons installer le module filebeats pour logstash afin que logstash soit capable de capturer et d'explorer les données brutes du côté client.
 [[email protected]_master opt]# /usr/share/logstash/bin/logstash-plugin install logstash-input-beats
Validating logstash-input-beats
Installing logstash-input-beats
Installation successful
Une fois l'installation et la configuration nécessaires pour logstash terminées, nous pouvons démarrer les services directement. Voici les étapes :
 [[email protected]_master opt]# service logstash restart
Redirecting to /bin/systemctl restart logstash.service

[[email protected]_master opt]# service logstash status
Redirecting to /bin/systemctl status logstash.service
? logstash.service - logstash
Loaded: loaded (/etc/systemd/system/logstash.service; disabled; vendor preset: disabled)
Active: active (running) since Sat 2018-06-09 13:17:40 UTC; 5s ago
Main PID: 8106 (java)
CGroup: /docker/2daaf895e0efa67ef70dbabd87b56d53815e94ff70432f692385f527e2dc488b/system.slice/logstash.service
??8106 /bin/java -Xms256m -Xmx1g -XX:+UseParNewGC -XX:+UseConcMarkSweepGC -XX:CMSInitiatingOccupancyFracti...

Jun 09 13:17:40 elk_master systemd[1]: Started logstash.
Jun 09 13:17:40 elk_master systemd[1]: Starting logstash...
[[email protected]_master opt]#

[[email protected]_master opt]# tail -f /var/log/logstash/logstash-plain.log
[2018-06-09T13:17:59,496][INFO ][logstash.outputs.elasticsearch] Elasticsearch pool URLs updated {:changes=>{:removed=>[], :added=>[http://172.17.0.6:9200/]}}
[2018-06-09T13:17:59,498][INFO ][logstash.outputs.elasticsearch] Running health check to see if an Elasticsearch connection is working {:healthcheck_url=>http://172.17.0.6:9200/, :path=>"/"}
[2018-06-09T13:17:59,976][WARN ][logstash.outputs.elasticsearch] Restored connection to ES instance {:url=>"http://172.17.0.6:9200/"}
[2018-06-09T13:18:00,083][INFO ][logstash.outputs.elasticsearch] ES Output version determined {:es_version=>nil}
[2018-06-09T13:18:00,083][WARN ][logstash.outputs.elasticsearch] Detected a 6.x and above cluster: the `type` event field won't be used to determine the document _type {:es_version=>6}
[2018-06-09T13:18:00,095][INFO ][logstash.outputs.elasticsearch] New Elasticsearch output {:class=>"LogStash::Outputs::ElasticSearch", :hosts=>["//172.17.0.6"]}
[2018-06-09T13:18:00,599][INFO ][logstash.inputs.beats ] Beats inputs: Starting input listener {:address=>"0.0.0.0:5044"}
[2018-06-09T13:18:00,652][INFO ][logstash.pipeline ] Pipeline started succesfully {:pipeline_id=>"main", :thread=>"#<Thread:[email protected]/usr/share/logstash/logstash-core/lib/logstash/pipeline.rb:246 sleep>"}
[2018-06-09T13:18:00,663][INFO ][org.logstash.beats.Server] Starting server on port: 5044
[2018-06-09T13:18:00,660][INFO ][logstash.agent ] Pipelines running {:count=>1, :pipelines=>["main"]}
[2018-06-09T13:18:24,060][INFO ][o.e.c.m.MetaDataCreateIndexService] [elk_master] [filebeat-6.2.1-2018.06.04] creating index, cause [auto(bulk api)], templates [], shards [5]/[1], mappings []
[2018-06-09T13:18:24,189][INFO ][o.e.c.m.MetaDataCreateIndexService] [elk_master] [filebeat-6.2.1-2018.06.09] creating index, cause [auto(bulk api)], templates [], shards [5]/[1], mappings []
[2018-06-09T13:18:24,288][INFO ][o.e.c.m.MetaDataCreateIndexService] [elk_master] [filebeat-6.2.1-2018.06.08] creating index, cause [auto(bulk api)], templates [], shards [5]/[1], mappings []
[2018-06-09T13:18:24,591][INFO ][o.e.c.m.MetaDataMappingService] [elk_master] [filebeat-6.2.1-2018.06.04/yPD91Ww0SD2ei4YI-FgLgQ] create_mapping [doc]
[2018-06-09T13:18:24,781][INFO ][o.e.c.m.MetaDataMappingService] [elk_master] [filebeat-6.2.1-2018.06.08/Qnv0gplFTgW0z1C6haZESg] create_mapping [doc]
[2018-06-09T13:18:24,882][INFO ][o.e.c.m.MetaDataMappingService] [elk_master] [filebeat-6.2.1-2018.06.09/dihjTJw3SjGncXYln2MXbA] create_mapping [doc]
[2018-06-09T13:18:24,996][INFO ][o.e.c.m.MetaDataMappingService] [elk_master] [filebeat-6.2.1-2018.06.09/dihjTJw3SjGncXYln2MXbA] update_mapping [doc]
As you can see, now logstash service have successfully started and starting to collect the data from each client side. As alternatives, you can use curl command to see the status and updates from logstash side. Below are the examples:
 [[email protected]_master opt]# curl -kL http://172.17.0.6:9200/_cat/indices?v
health status index uuid pri rep docs.count docs.deleted store.size pri.store.size
yellow open filebeat-6.2.1-2018.06.09 dihjTJw3SjGncXYln2MXbA 5 1 6 0 35.2kb 35.2kb
yellow open filebeat-6.2.1-2018.06.04 yPD91Ww0SD2ei4YI-FgLgQ 5 1 350 0 186.4kb 186.4kb
yellow open filebeat-6.2.1-2018.06.08 Qnv0gplFTgW0z1C6haZESg 5 1 97 0 89.4kb 89.4kb
Last but not least, we'll need to setup and configure kibana services to make a complete centralized management server. Just a footnote, as kibana are used to ease the process of gathering and analyzing the data through visualization, it is not an important packages like elasticSearch or logstash if you are setting up the server under a smaller box. Yet to proceed, below are the steps on installation and configuration:
 [[email protected]_master opt]# wget https://artifacts.elastic.co/downloads/kibana/kibana-6.2.1-linux-x86_64.tar.gz
--2018-06-09 13:21:41-- https://artifacts.elastic.co/downloads/kibana/kibana-6.2.1-linux-x86_64.tar.gz
Resolving artifacts.elastic.co (artifacts.elastic.co)... 107.21.237.188, 107.21.237.95, 107.21.253.15, ...
Connecting to artifacts.elastic.co (artifacts.elastic.co)|107.21.237.188|:443... connected.
HTTP request sent, awaiting response... 200 OK
Length: 83465500 (80M) [binary/octet-stream]
Saving to: ‘kibana-6.2.1-linux-x86_64.tar.gz’

100%[==============================================================================>] 83,465,500 2.76MB/s in 41s

2018-06-09 13:22:28 (1.94 MB/s) - ‘kibana-6.2.1-linux-x86_64.tar.gz’ saved [83465500/83465500]

[[email protected]_master opt]# tar -zxvf kibana-6.2.1-linux-x86_64.tar.gz
[[email protected]_master opt]# ln -s /opt/kibana-6.2.1-linux-x86_64 /opt/kibana

[[email protected]_master opt]# vi kibana/config/kibana.yml

server.host: "172.17.0.6"
server.port: 5601
elasticsearch.url: "http://172.17.0.6:9200"
Noted on above that I've link the kibana with our ElasticSearch service inside the configuration and assign a port that will be use by Kibana service once started. Now as everything are already set in place, we can startup the final services. Voici les étapes :
 [[email protected]_master opt]# /opt/kibana/bin/kibana --version
6.2.1

[[email protected]_master opt]# /opt/kibana/bin/kibana &
[1] 8640
[[email protected]_master opt]# log [13:26:20.034] [info][status][plugin:[email protected]] Status changed from uninitialized to green - Ready
log [13:26:20.073] [info][status][plugin:[email protected]] Status changed from uninitialized to yellow - Waiting for Elasticsearch
log [13:26:20.193] [info][status][plugin:[email protected]] Status changed from uninitialized to green - Ready
log [13:26:20.200] [info][status][plugin:[email protected]] Status changed from uninitialized to green - Ready
log [13:26:20.212] [info][status][plugin:[email protected]] Status changed from uninitialized to green - Ready
log [13:26:20.233] [info][listening] Server running at http://172.17.0.6:5601
log [13:26:20.276] [info][status][plugin:[email protected]] Status changed from yellow to green - Ready


[[email protected]_master opt]# netstat -apn|grep -i :5601
tcp 0 0 172.17.0.6:5601 0.0.0.0:* LISTEN 8640/node
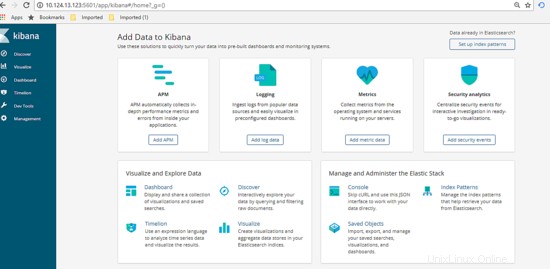
Great, now everything are up and running as per shown above using the netstat command. Now let's view the Dashboard of Kibana and made the configuration. Got to url http://172.17.0.6:5601/app , you'll see the dashboard will be shown like below.
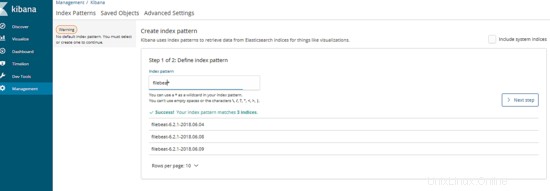
Next on the dashboard, click on Management tab then define the index pattern, for our cases the index pattern are define as our logging filename generated. Type in the information then click next.
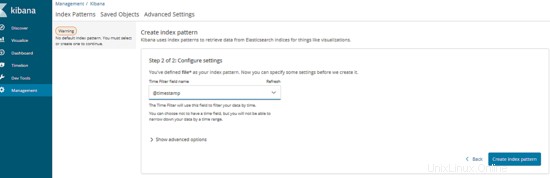
After that, type in the variables that will be use as time series. Once done, click Create Index Pattern. Below are the example:
Excellent, now the management server are ready to be use. Let's proceed by testing the usability.
4. Testing Phase
Before we start the test, let's make the assumption for final result expections. For this test, we will try to execute a database query that will pass the long query time assign from client which is MySQL server. Once we execute, our centralized management server should automatically show the result of slow query information as graph via Kibana dashboard. Now as everything is clear, let's start the test, below are the step:
Log into any of the client server and execute the slow query SQL like below:
 [[email protected]_db1 ~]# mysql --login-path=root -P 3306 --prompt='TEST>'
Welcome to the MySQL monitor. Commands end with ; or \g.
Your MySQL connection id is 193
Server version: 5.7.21-log MySQL Community Server (GPL)

Copyright (c) 2000, 2018, Oracle and/or its affiliates. All rights reserved.

Oracle is a registered trademark of Oracle Corporation and/or its
affiliates. Other names may be trademarks of their respective
owners.

Type 'help;' or '\h' for help. Type '\c' to clear the current input statement.

TEST>select sleep(5);
+----------+
| sleep(5) |
+----------+
| 0 |
+----------+
1 row in set (5.01 sec)

TEST>select sleep(6);
+----------+
| sleep(6) |
+----------+
| 0 |
+----------+
1 row in set (6.00 sec)

TEST>select sleep(10) 'run for 10 seconds';
+--------------------+
| run for 10 seconds |
+--------------------+
| 0 |
+--------------------+
1 row in set (10.00 sec)

TEST>select sleep(3) 'test again';
+------------+
| test again |
+------------+
| 0 |
+------------+
1 row in set (3.00 sec)

TEST>exit
Bye
As shown above, we've manage to produce some of slow query that automatically jotted into each client slow query log. Now, let's go to the dashboard and see if the data information successfully been crawl by centralized server and convert it as visualization graph.
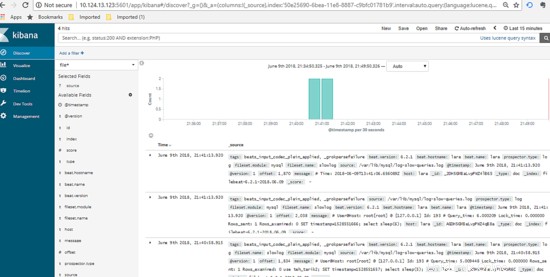
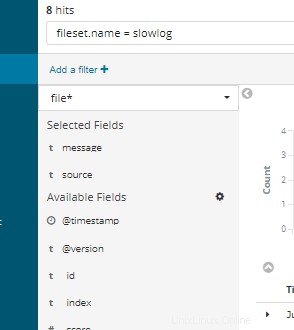
Great, as per shown above there are list of logging information succcessfully been crawl and viewed through kibana dashboard. You can use the left tab to filter what type of column you want to show or hide, below are the example :-
Using the textfield on top of the dashboard, you can type in SQL query related to view certain information or part of the data needed.
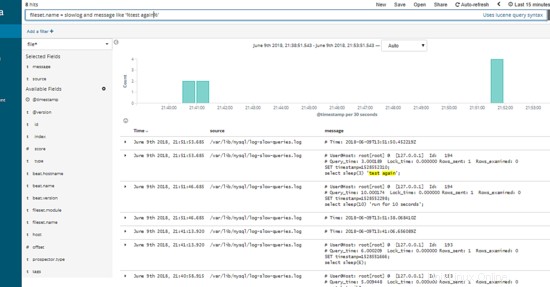
Excellent, as show above the slow query SQL that we've produce initially from 1 of our client server automatically shown under our Kibana Dashboard per expected.