Bases
Perf est un outil de profilage utile qui pourrait être utile pour tracer les appels/fonctions du noyau/de l'application et bien d'autres. Par exemple, pour démarrer perf en tant qu'outil de surveillance en direct similaire à top execute :
# perf top
Il affichera les compteurs de performance en temps réel. Exemple de sortie :
PerfTop: 474 irqs/sec kernel:100.0% exact: 0.0% [4000Hz cpu-clock], (all, 6 CPUs)
---------------------------------------------------------------------------------------------------------------------------------------------------------------------------------------------------------------

22.45% perf.3.8.13-98.7.1.el7uek.x86_64 [.] dso__load_kallsyms
16.33% perf.3.8.13-98.7.1.el7uek.x86_64 [.] symbol_filter
12.24% [kernel] [k] kallsyms_expand_symbol
10.20% [kernel] [k] module_get_kallsym
10.20% [kernel] [k] vsnprintf
La première ligne est un pourcentage de temps passé, la deuxième est la fonction et la troisième est DSO (objet partagé dynamique).
Exemple d'utilisation des performances – 1
Lors de l'exécution de la vitesse d'opération d'écriture dd semble être bloquée à environ 50 Mo/s - l'indicateur direct n'est pas utilisé :
# dd if=/dev/zero of=/u01/test1 bs=1M count=500
500+0 records in
500+0 records out
524288000 bytes (524 MB) copied, 9.44658 s, 55.5 MB/s
Là où le passage à un autre système de fichiers semble être beaucoup plus rapide :
# dd if=/dev/zero of=/u02/test1 bs=1M count=500
500+0 records in
500+0 records out
524288000 bytes (524 MB) copied, 0.166796 s, 3.1 GB/s
Commençons la commande dd avec perf :
# perf record dd if=/dev/zero of=/u01/test1 bs=1M count=500
500+0 records in
500+0 records out
524288000 bytes (524 MB) copied, 10.7182 s, 48.9 MB/s
[ perf record: Woken up 2 times to write data ]
[ perf record: Captured and wrote 0.364 MB perf.data (~15920 samples) ]
Passons en revue les données :
# perf report

# ========
# captured on: Sat Aug 20 07:09:38 2016
# hostname : localhost.localdomain
# os release : 3.8.13-98.7.1.el7uek.x86_64
# perf version : 3.8.13-98.7.1.el7uek.x86_64
# arch : x86_64
# nrcpus online : 6
# nrcpus avail : 6
# cpudesc : Intel(R) Core(TM) i7-4790K CPU @ 4.00GHz
# cpuid : GenuineIntel,6,60,3
# total memory : 3785340 kB
# cmdline : /usr/libexec/perf.3.8.13-98.7.1.el7uek.x86_64 record dd if=/dev/zero of=/u01/test1 bs=1M count=500
# event : name = cpu-clock, type = 1, config = 0x0, config1 = 0x0, config2 = 0x0, excl_usr = 0, excl_kern = 0, excl_host = 0, excl_guest = 1, precise_ip = 0, id = { 25, 26, 27, 28, 29, 30 }
# HEADER_CPU_TOPOLOGY info available, use -I to display
# HEADER_NUMA_TOPOLOGY info available, use -I to display
# pmu mappings: software = 1, tracepoint = 2, breakpoint = 5
# ========
#
# Samples: 9K of event 'cpu-clock'
# Event count (approx.): 9256
#
# Overhead Command Shared Object Symbol
# ........ ....... ................. ...........................................
#
46.72% dd [kernel.kallsyms] [k] native_read_tsc
43.90% dd [kernel.kallsyms] [k] loop_make_request
1.77% dd [kernel.kallsyms] [k] finish_task_switch
D'après la sortie, nous pouvons voir que dd est à l'origine d'un écoute des ressources système (native_read_tsc et loop_make_request). /u01 est un périphérique en boucle utilisé plus tard comme volume lvm2.
Débogage supplémentaire avec perf lors de l'utilisation de l'option graphcall :
# perf record -g fp dd if=/dev/zero of=/u01/test1 bs=1M count=500
500+0 records in
500+0 records out
524288000 bytes (524 MB) copied, 10.9209 s, 48.0 MB/s
[ perf record: Woken up 9 times to write data ]
[ perf record: Captured and wrote 2.270 MB perf.data (~99186 samples) ]
Passons en revue les données :
# perf report
# ........ ....... ................. ...........................................
#
53.13% dd [kernel.kallsyms] [k] native_read_tsc
|
--- native_read_tsc
|
|--99.08%-- read_tsc
| ktime_get_ts
| |
| |--89.51%-- __delayacct_blkio_start
| | io_schedule
| | |
| | |--99.68%-- sleep_on_buffer
| | | __wait_on_bit
| | | out_of_line_wait_on_bit
| | | __wait_on_buffer
| | | |
| | | |--98.42%-- __sync_dirty_buffer
| | | | sync_dirty_buffer
| | | | |
| | | | |--98.51%-- ext2_new_blocks
| | | | | ext2_get_blocks
| | | | | ext2_get_block
| | | | | __block_write_begin
| | | | | block_write_begin
| | | | | ext2_write_begin
| | | | | generic_file_buffered_write_iter
| | | | | __generic_file_write_iter
| | | | | generic_file_write_iter
| | | | | do_aio_write
| | | | | do_sync_write
| | | | | vfs_write
| | | | | sys_write
| | | | | system_call_fastpath
| | | | | __GI___libc_write
| | | | |
| | | | |--1.33%-- __ext2_write_inode
| | | | | ext2_write_inode
| | | | | __writeback_single_inode
| | | | | writeback_single_inode
| | | | | sync_inode
| | | | | sync_inode_metadata
| | | | | generic_file_fsync
| | | | | ext2_fsync
| | | | | generic_write_sync
| | | | | generic_file_write_iter
| | | | | do_aio_write
| | | | | do_sync_write
| | | | | vfs_write
| | | | | sys_write
| | | | | system_call_fastpath
| | | | | __GI___libc_write
| | | | --0.16%-- [...]
| | | |
| | | --1.58%-- sync_mapping_buffers
| | | generic_file_fsync
| | | ext2_fsync
| | | generic_write_sync
| | | generic_file_write_iter
| | | do_aio_write
| | | do_sync_write
| | | vfs_write
| | | sys_write
| | | system_call_fastpath
| | | __GI___libc_write
| | --0.32%-- [...]
| |
| --10.49%-- delayacct_end
| __delayacct_blkio_end
| io_schedule
| |
| |--90.00%-- sleep_on_buffer
| | __wait_on_bit
| | out_of_line_wait_on_bit
| | __wait_on_buffer
À partir de cette sortie, nous pouvons voir beaucoup plus d'informations sur l'activité de la commande dd. Tout d'abord, nous voyons que l'exécution de la commande dd montre que nous effectuons des écritures synchrones, ce qui nous oblige à utiliser sync_write.
Le deuxième exemple provient de /u02 :
# perf record -g fp dd if=/dev/zero of=/u02/test1 bs=1M count=500
500+0 records in
500+0 records out
524288000 bytes (524 MB) copied, 0.178937 s, 2.9 GB/s
[ perf record: Woken up 1 times to write data ]
[ perf record: Captured and wrote 0.093 MB perf.data (~4083 samples) ]
Passons en revue les données :
# perf report

# ========
# captured on: Sat Aug 20 07:37:05 2016
# hostname : localhost.localdomain
# os release : 3.8.13-98.7.1.el7uek.x86_64
# perf version : 3.8.13-98.7.1.el7uek.x86_64
# arch : x86_64
# nrcpus online : 6
# nrcpus avail : 6
# cpudesc : Intel(R) Core(TM) i7-4790K CPU @ 4.00GHz
# cpuid : GenuineIntel,6,60,3
# total memory : 3785340 kB
# cmdline : /usr/libexec/perf.3.8.13-98.7.1.el7uek.x86_64 record -g fp dd if=/dev/zero of=/test1 bs=1M count=500
# event : name = cpu-clock, type = 1, config = 0x0, config1 = 0x0, config2 = 0x0, excl_usr = 0, excl_kern = 0, excl_host = 0, excl_guest = 1, precise_ip = 0, id = { 39, 40, 41, 42, 43, 44 }
# HEADER_CPU_TOPOLOGY info available, use -I to display
# HEADER_NUMA_TOPOLOGY info available, use -I to display
# pmu mappings: software = 1, tracepoint = 2, breakpoint = 5
# ========
#
# Samples: 503 of event 'cpu-clock'
# Event count (approx.): 503
#
# Overhead Command Shared Object Symbol
# ........ ....... ................. ...........................................
#
16.70% dd [kernel.kallsyms] [k] copy_user_generic_string
|
--- copy_user_generic_string
generic_file_buffered_write_iter
xfs_file_buffered_aio_write
xfs_file_write_iter
do_aio_write
do_sync_write
vfs_write
sys_write
system_call_fastpath
__GI___libc_write

11.33% dd [kernel.kallsyms] [k] __clear_user
|
--- __clear_user
read_zero
vfs_read
sys_read
system_call_fastpath
__GI___libc_read

5.77% dd [kernel.kallsyms] [k] get_page_from_freelist
|
--- get_page_from_freelist
|
|--93.10%-- __alloc_pages_nodemask
| alloc_pages_current
| __page_cache_alloc
| grab_cache_page_write_begin
| xfs_vm_write_begin
| generic_file_buffered_write_iter
| xfs_file_buffered_aio_write
| xfs_file_write_iter
| do_aio_write
| do_sync_write
| vfs_write
| sys_write
| system_call_fastpath
| __GI___libc_write
|
--6.90%-- alloc_pages_current
__page_cache_alloc
grab_cache_page_write_begin
xfs_vm_write_begin
generic_file_buffered_write_iter
xfs_file_buffered_aio_write
xfs_file_write_iter
do_aio_write
do_sync_write
vfs_write
sys_write
system_call_fastpath
__GI___libc_write
La surcharge est beaucoup plus faible et nous effectuons en fait un sys_write standard après l'allocation des pages - en effet, dans ce cas, notre demande de commande dd est d'abord placée dans le cache, puis envoyée au périphérique principal réel.
Exécutons une autre option de performance qui surveillera de près les tâches du planificateur du noyau sur notre fichier de test /u01.
# perf record -e sched:sched_switch -e sched:sched_wakeup -e block:* -ag fp dd if=/dev/zero of=/u01/test1 bs=1M count=500
500+0 records in
500+0 records out
524288000 bytes (524 MB) copied, 16.9048 s, 31.0 MB/s
[ perf record: Woken up 3066 times to write data ]
[ perf record: Captured and wrote 767.200 MB perf.data (~33519496 samples) ]
Utilisons le script perf pour générer les données volumineuses :
# perf script
# ========
# captured on: Sat Aug 20 07:50:23 2016
# hostname : localhost.localdomain
# os release : 3.8.13-98.7.1.el7uek.x86_64
# perf version : 3.8.13-98.7.1.el7uek.x86_64
# arch : x86_64
# nrcpus online : 6
# nrcpus avail : 6
# cpudesc : Intel(R) Core(TM) i7-4790K CPU @ 4.00GHz
# cpuid : GenuineIntel,6,60,3
# total memory : 3785340 kB
# cmdline : /usr/libexec/perf.3.8.13-98.7.1.el7uek.x86_64 record -e sched:sched_switch -e sched:sched_wakeup -e block:* -ag fp dd if=/dev/zero of=/u01/test1 bs=1M count=500
# event : name = sched:sched_switch, type = 2, config = 0x11a, config1 = 0x0, config2 = 0x0, excl_usr = 0, excl_kern = 0, excl_host = 0, excl_guest = 1, precise_ip = 0, id = { 45, 46, 47, 48, 49, 50 }
# event : name = sched:sched_wakeup, type = 2, config = 0x11c, config1 = 0x0, config2 = 0x0, excl_usr = 0, excl_kern = 0, excl_host = 0, excl_guest = 1, precise_ip = 0, id = { 51, 52, 53, 54, 55, 56 }
# event : name = block:block_rq_remap, type = 2, config = 0x2be, config1 = 0x0, config2 = 0x0, excl_usr = 0, excl_kern = 0, excl_host = 0, excl_guest = 1, precise_ip = 0, id = { 57, 58, 59, 60, 61, 62 }
# event : name = block:block_bio_remap, type = 2, config = 0x2bf, config1 = 0x0, config2 = 0x0, excl_usr = 0, excl_kern = 0, excl_host = 0, excl_guest = 1, precise_ip = 0, id = { 63, 64, 65, 66, 67, 68 }
# event : name = block:block_split, type = 2, config = 0x2c0, config1 = 0x0, config2 = 0x0, excl_usr = 0, excl_kern = 0, excl_host = 0, excl_guest = 1, precise_ip = 0, id = { 69, 70, 71, 72, 73, 74 }
# event : name = block:block_unplug, type = 2, config = 0x2c1, config1 = 0x0, config2 = 0x0, excl_usr = 0, excl_kern = 0, excl_host = 0, excl_guest = 1, precise_ip = 0, id = { 75, 76, 77, 78, 79, 80 }
# event : name = block:block_plug, type = 2, config = 0x2c2, config1 = 0x0, config2 = 0x0, excl_usr = 0, excl_kern = 0, excl_host = 0, excl_guest = 1, precise_ip = 0, id = { 81, 82, 83, 84, 85, 86 }
# event : name = block:block_sleeprq, type = 2, config = 0x2c3, config1 = 0x0, config2 = 0x0, excl_usr = 0, excl_kern = 0, excl_host = 0, excl_guest = 1, precise_ip = 0, id = { 87, 88, 89, 90, 91, 92 }
# event : name = block:block_getrq, type = 2, config = 0x2c4, config1 = 0x0, config2 = 0x0, excl_usr = 0, excl_kern = 0, excl_host = 0, excl_guest = 1, precise_ip = 0, id = { 93, 94, 95, 96, 97, 98 }
# event : name = block:block_bio_queue, type = 2, config = 0x2c5, config1 = 0x0, config2 = 0x0, excl_usr = 0, excl_kern = 0, excl_host = 0, excl_guest = 1, precise_ip = 0, id = { 99, 100, 101, 102, 103, 104 }
# event : name = block:block_bio_frontmerge, type = 2, config = 0x2c6, config1 = 0x0, config2 = 0x0, excl_usr = 0, excl_kern = 0, excl_host = 0, excl_guest = 1, precise_ip = 0, id = { 105, 106, 107, 108, 109, 110 }
# event : name = block:block_bio_backmerge, type = 2, config = 0x2c7, config1 = 0x0, config2 = 0x0, excl_usr = 0, excl_kern = 0, excl_host = 0, excl_guest = 1, precise_ip = 0, id = { 111, 112, 113, 114, 115, 116 }
# event : name = block:block_bio_complete, type = 2, config = 0x2c8, config1 = 0x0, config2 = 0x0, excl_usr = 0, excl_kern = 0, excl_host = 0, excl_guest = 1, precise_ip = 0, id = { 117, 118, 119, 120, 121, 122 }
# event : name = block:block_bio_bounce, type = 2, config = 0x2c9, config1 = 0x0, config2 = 0x0, excl_usr = 0, excl_kern = 0, excl_host = 0, excl_guest = 1, precise_ip = 0, id = { 123, 124, 125, 126, 127, 128 }
# event : name = block:block_rq_issue, type = 2, config = 0x2ca, config1 = 0x0, config2 = 0x0, excl_usr = 0, excl_kern = 0, excl_host = 0, excl_guest = 1, precise_ip = 0, id = { 129, 130, 131, 132, 133, 134 }
# event : name = block:block_rq_insert, type = 2, config = 0x2cb, config1 = 0x0, config2 = 0x0, excl_usr = 0, excl_kern = 0, excl_host = 0, excl_guest = 1, precise_ip = 0, id = { 135, 136, 137, 138, 139, 140 }
# event : name = block:block_rq_complete, type = 2, config = 0x2cc, config1 = 0x0, config2 = 0x0, excl_usr = 0, excl_kern = 0, excl_host = 0, excl_guest = 1, precise_ip = 0, id = { 141, 142, 143, 144, 145, 146 }
# event : name = block:block_rq_requeue, type = 2, config = 0x2cd, config1 = 0x0, config2 = 0x0, excl_usr = 0, excl_kern = 0, excl_host = 0, excl_guest = 1, precise_ip = 0, id = { 147, 148, 149, 150, 151, 152 }
# event : name = block:block_rq_abort, type = 2, config = 0x2ce, config1 = 0x0, config2 = 0x0, excl_usr = 0, excl_kern = 0, excl_host = 0, excl_guest = 1, precise_ip = 0, id = { 153, 154, 155, 156, 157, 158 }
# HEADER_CPU_TOPOLOGY info available, use -I to display
# HEADER_NUMA_TOPOLOGY info available, use -I to display
# pmu mappings: software = 1, tracepoint = 2, breakpoint = 5
dd 9615 [001] 3378.902792: block:block_bio_queue: 252,2 WS 488 + 8 [dd]
dd 9615 [001] 3378.902798: block:block_bio_remap: 7,1 WS 2536 + 8 <- (252,2) 488
dd 9615 [001] 3378.902810: block:block_bio_queue: 7,1 WS 2536 + 8 [dd]
dd 9615 [001] 3378.902848: sched:sched_switch: prev_comm=dd prev_pid=9615 prev_prio=120 prev_state=D ==> next_comm=swapper/1 next_pid=0 next_prio=120
swapper 0 [000] 3378.902883: sched:sched_wakeup: comm=loop1 pid=2464 prio=100 success=1 target_cpu=000
swapper 0 [000] 3378.902896: sched:sched_switch: prev_comm=swapper/0 prev_pid=0 prev_prio=120 prev_state=R ==> next_comm=loop1 next_pid=2464 next_prio=100
loop1 2464 [000] 3378.902995: block:block_bio_queue: 252,0 WS 5546280 + 8 [loop1]
loop1 2464 [000] 3378.903040: block:block_bio_remap: 8,2 WS 6801704 + 8 <- (252,0) 5546280
loop1 2464 [000] 3378.903064: block:block_bio_remap: 8,0 WS 7827752 + 8 <- (8,2) 6801704
loop1 2464 [000] 3378.903067: block:block_bio_queue: 8,0 WS 7827752 + 8 [loop1]
loop1 2464 [000] 3378.903074: block:block_getrq: 8,0 WS 7827752 + 8 [loop1]
loop1 2464 [000] 3378.903077: block:block_plug: [loop1]
loop1 2464 [000] 3378.903080: block:block_rq_insert: 8,0 WS 0 () 7827752 + 8 [loop1]
loop1 2464 [000] 3378.903083: block:block_unplug: [loop1] 1
loop1 2464 [000] 3378.903086: block:block_rq_issue: 8,0 WS 0 () 7827752 + 8 [loop1]
loop1 2464 [000] 3378.903110: sched:sched_switch: prev_comm=loop1 prev_pid=2464 prev_prio=100 prev_state=S ==> next_comm=swapper/0 next_pid=0 next_prio=120
dd 9615 [000] 3378.903290: block:block_bio_queue: 252,2 WS 488 + 8 [dd]
dd 9615 [000] 3378.903293: block:block_bio_remap: 7,1 WS 2536 + 8 <- (252,2) 488
dd 9615 [000] 3378.903295: block:block_bio_queue: 7,1 WS 2536 + 8 [dd]
dd 9615 [000] 3378.903299: sched:sched_wakeup: comm=loop1 pid=2464 prio=100 success=1 target_cpu=000
dd 9615 [000] 3378.903301: sched:sched_switch: prev_comm=dd prev_pid=9615 prev_prio=120 prev_state=R ==> next_comm=loop1 next_pid=2464 next_prio=100
loop1 2464 [000] 3378.903305: block:block_bio_queue: 252,0 WS 5546280 + 8 [loop1]
loop1 2464 [000] 3378.903308: block:block_bio_remap: 8,2 WS 6801704 + 8 <- (252,0) 5546280
loop1 2464 [000] 3378.903311: block:block_bio_remap: 8,0 WS 7827752 + 8 <- (8,2) 6801704
loop1 2464 [000] 3378.903314: block:block_bio_queue: 8,0 WS 7827752 + 8 [loop1]
loop1 2464 [000] 3378.903318: block:block_getrq: 8,0 WS 7827752 + 8 [loop1]
loop1 2464 [000] 3378.903320: block:block_plug: [loop1]
loop1 2464 [000] 3378.903323: block:block_rq_insert: 8,0 WS 0 () 7827752 + 8 [loop1]
loop1 2464 [000] 3378.903325: block:block_unplug: [loop1] 1
loop1 2464 [000] 3378.903327: block:block_rq_issue: 8,0 WS 0 () 7827752 + 8 [loop1]
loop1 2464 [000] 3378.903340: sched:sched_switch: prev_comm=loop1 prev_pid=2464 prev_prio=100 prev_state=S ==> next_comm=dd next_pid=9615 next_prio=120
dd 9615 [000] 3378.903345: sched:sched_switch: prev_comm=dd prev_pid=9615 prev_prio=120 prev_state=D ==> next_comm=swapper/0 next_pid=0 next_prio=120
We can clearly see that dd and loop1 device is doing WS ( write-sync ) so indeed data is being written in sychronous fashion rather than going into cache first.
Ce qui semble être un bogue udev qui monte le système de fichiers avec l'indicateur -o sync au démarrage (même si /etc/fstab ne spécifie pas l'option de synchronisation) :
# mount
/dev/mapper/vgdb-lvu01 on /u01 type ext2 (rw,relatime,sync,seclabel,errors=continue,user_xattr,acl)
/dev/mapper/vgdb-lvu02 on /u02 type ext2 (rw,relatime,async,seclabel,errors=continue,user_xattr,acl)
Vérification de fstab :
# cat /etc/fstab
/dev/mapper/ol-root / xfs defaults 0 0
/dev/mapper/vgdb-lvu01 /u01 ext2 rw 0 0
/dev/mapper/vgdb-lvu02 /u02 ext2 rw,async 0 0
Exemple d'utilisation des performances – 2
Lors de l'exécution dd, la vitesse d'opération d'écriture sur le premier nœud est d'environ 350 Mo/s, tandis que sur le second nœud, elle est de 3 Go/s.
Premier nœud :
# dd if=/dev/zero of=/u01/test1 bs=1M count=500
500+0 records in
500+0 records out
524288000 bytes (524 MB) copied, 1.45869 s, 359 MB/s
Deuxième nœud :
# dd if=/dev/zero of=/u01/test1 bs=1M count=500
500+0 records in
500+0 records out
524288000 bytes (524 MB) copied, 0.174886 s, 3.0 GB/s
Exécutons perf top et voyons ce qui pourrait exactement ralentir notre écriture sur le nœud 1 :
PerfTop: 13741 irqs/sec kernel:91.0% exact: 0.0% [4000Hz cpu-clock], (all, 6 CPUs)
---------------------------------------------------------------------------------------------------------------------------------------------------------------------------------------------------------------

20.00% [kernel] [k] clear_page_c
10.97% [kernel] [k] get_page_from_freelist
10.38% [kernel] [k] _raw_spin_unlock_irqrestore
9.17% [kernel] [k] free_hot_cold_page
9.11% Java [.] ZN10JavaCalls
7.67% [kernel] [k] __do_page_fault
5.23% [kernel] [k] __mem_cgroup_commit_charge.constprop.45
5.21% [kernel] [k] __mem_cgroup_try_charge
D'après la sortie, nous pouvons voir que le noyau efface principalement les pages et alloue des pages. Dans la sortie, nous voyons également que le processus Java est activement utilisé. Jetons un coup d'œil au processus Java :
# perf top -s pid,comm
PerfTop: 14134 irqs/sec kernel:91.0% exact: 0.0% [4000Hz cpu-clock], (all, 6 CPUs)
---------------------------------------------------------------------------------------------------------------------------------------------------------------------------------------------------------------
10.86% Java: 9687 Java
10.61% Java: 9685 Java
10.50% Java: 9686 Java
10.34% Java: 9688 Java
10.22% Java: 9694 Java
10.04% Java: 9691 Java
9.70% Java: 9692 Java
9.52% Java: 9690 Java
8.98% Java: 9693 Java
8.85% Java: 9689 Java
Regardons aussi au niveau des symboles :
# perf top -s pid,comm,symbol,parent
PerfTop: 13865 irqs/sec kernel:90.9% exact: 0.0% [4000Hz cpu-clock], (all, 6 CPUs)
---------------------------------------------------------------------------------------------------------------------------------------------------------------------------------------------------------------

2.49% Java: 9691 Java [k] clear_page_c [other]
2.08% Java: 9687 Java [k] clear_page_c [other]
2.07% Java: 9692 Java [k] clear_page_c [other]
2.01% Java: 9689 Java [k] clear_page_c [other]
1.99% Java: 9688 Java [k] clear_page_c [other]
1.95% Java: 9690 Java [k] clear_page_c [other]
1.94% Java: 9686 Java [k] clear_page_c [other]
1.92% Java: 9685 Java [k] clear_page_c [other]
1.92% Java: 9694 Java [k] clear_page_c [other]
1.61% Java: 9693 Java [k] clear_page_c [other]
1.32% Java: 9691 Java [k] get_page_from_freelist [other]
1.31% Java: 9691 Java [k] _raw_spin_unlock_irqrestore [other]
1.26% Java: 9691 Java [k] free_hot_cold_page [other]
1.15% Java: 9685 Java [k] _raw_spin_unlock_irqrestore [other]
1.14% Java: 9694 Java [k] get_page_from_freelist [other]
1.14% Java: 9694 Java [k] _raw_spin_unlock_irqrestore [other]
1.14% Java: 9692 Java [k] get_page_from_freelist [other]
1.13% Java: 9689 Java [k] _raw_spin_unlock_irqrestore [other]
1.13% Java: 9690 Java [k] get_page_from_freelist [other]
1.11% Java: 9692 Java [k] _raw_spin_unlock_irqrestore [other]
Nous pouvons voir que les processus JAVA utilisent activement les régions mémoire. Le deuxième nœud est complètement inactif car il s'agit d'une configuration active-passive :
PerfTop: 474 irqs/sec kernel:100.0% exact: 0.0% [4000Hz cpu-clock], (all, 6 CPUs)
---------------------------------------------------------------------------------------------------------------------------------------------------------------------------------------------------------------

22.45% perf.3.8.13-98.7.1.el7uek.x86_64 [.] dso__load_kallsyms
16.33% perf.3.8.13-98.7.1.el7uek.x86_64 [.] symbol_filter
12.24% [kernel] [k] kallsyms_expand_symbol
10.20% [kernel] [k] module_get_kallsym
10.20% [kernel] [k] vsnprintf
Rien n'est utilisé sur node2. L'équipe d'application a été invitée à arrêter les processus Java qui entraînent une surcharge sur la région de la mémoire - ce qui ralentit la commande dd qui utilise la mémoire pour l'écriture du cache.
Ensuite, la vitesse d'écriture est revenue à la normale :
# dd if=/dev/zero of=/u01/test1 bs=1M count=500
500+0 records in
500+0 records out
524288000 bytes (524 MB) copied, 0.174886 s, 2.9 GB/s
Autres exemples
1. Surveillez l'activité de tous les processeurs pendant 10 secondes :
# perf record -g -a sleep 10
Obtenez ensuite le rapport :
# perf report
2. Surveillez un PID spécifique pendant 10 secondes :
# perf record -p PID -g -- sleep 10
Obtenez ensuite le rapport :
# perf report
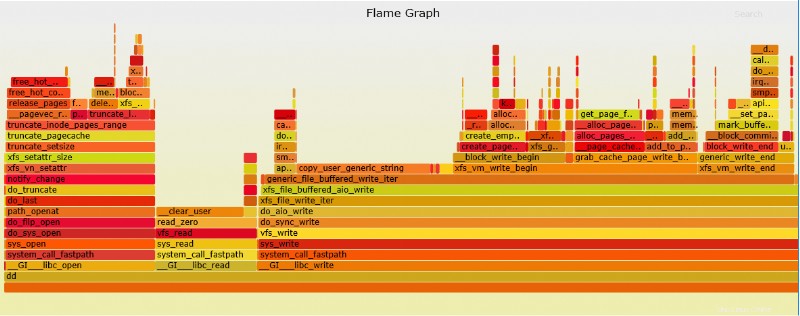
Perf flame-graph
Perf est capable de créer un graphique de flamme qui est beaucoup plus facile à interpréter.
1. Assurez-vous d'abord que git est installé :
# yum install git
2. Extrayez ensuite le script python graph de git (première modification du répertoire où FlameGraph doit être situé):
# git clone https://github.com/brendangregg/FlameGraph
3. Exécutez l'exemple de suivi des performances :
# perf record -g fp dd if=/dev/zero of=/test1 bs=1M count=500
500+0 records in
500+0 records out
524288000 bytes (524 MB) copied, 0.227305 s, 2.3 GB/s
[ perf record: Woken up 1 times to write data ]
[ perf record: Captured and wrote 0.110 MB perf.data (~4827 samples) ]
4. Convertir la sortie en graphique (SVC) :
# perf script | ./stackcollapse-perf.pl > out.perf-folded
# ./flamegraph.pl out.perf-folded > perf-kernel.svg
Le fichier SVG sera maintenant situé dans le répertoire.
Exemple de fichier SVG ci-dessus dd perf
Réflexions finales
Perf peut être un excellent ajout aux outils de débogage du système d'exploitation, ce qui aidera à résoudre tous les problèmes de profilage du noyau/de l'application. Cet outil peut facilement indiquer où se situe le problème ou quelle partie de la fonction dans l'application/la commande/le noyau est à l'origine de la lenteur. De plus, Perf peut facilement remplacer strace car il entraîne moins de surcharge et offre une option bien supérieure pour déboguer les appels système.